✦ PROFESSIONAL DATA ANALYTICS TRAINING IN DELHI

Master Data Analytics Course in Delhi & Build Your Career

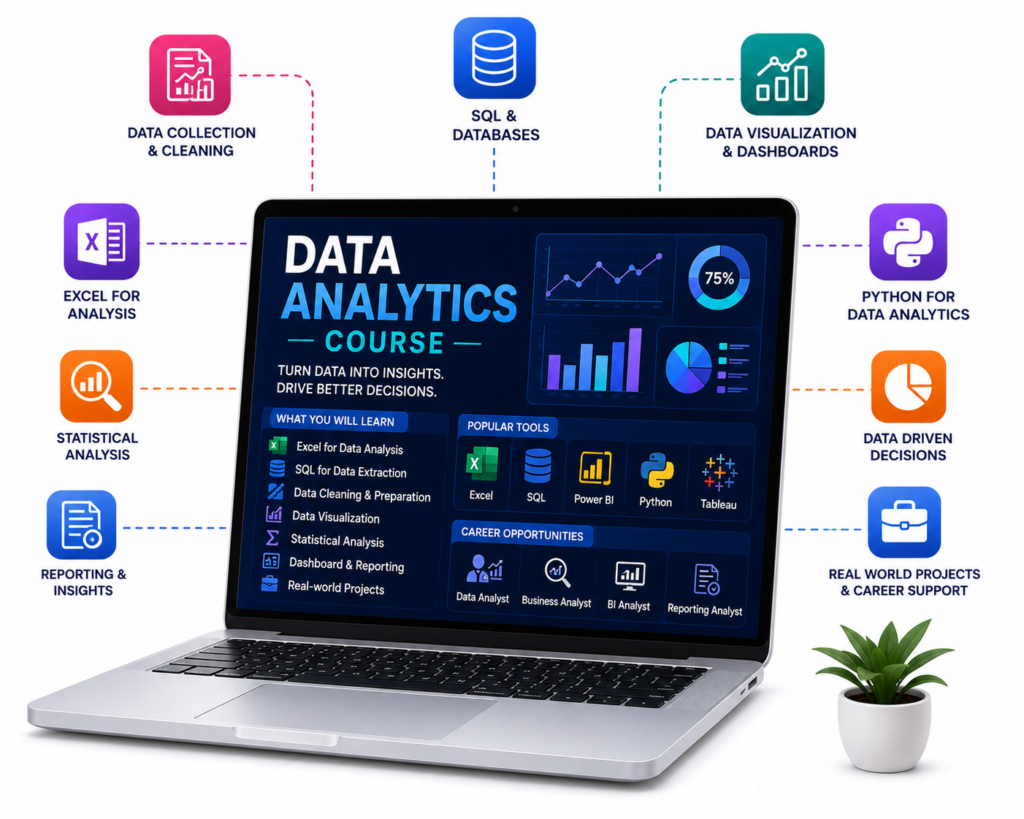
Join the Data Analytics Course in Delhi at Tech Explica and develop the skills to turn raw data into meaningful insights. Get practical training in Advanced Excel, SQL, Python and Power BI, work on real-world projects, and prepare yourself for exciting career opportunities in the growing field of Data Analytics.

🎓

DEMO CLASS

🏆

CERTIFICATE

👨‍🏫

EXPERT MENTOR

💼

JOB SUPPORT

Data Analytics Course in Delhi Pitampura with tech explica
👥
6,000+
Students Trained
🎓
50+
Professional Courses
👨‍💼
100+
Career Opportunities
🤝
100%
Placement Assistance

What is Data Analytics and Why is it Important?

Data Analytics refers to the process of collecting, processing, organizing, and analyzing raw data to uncover hidden information, identify patterns, generate meaningful insights, and support better decision-making. It helps businesses understand what’s happening, why it’s happening, and what actions they can take to improve their overall performance. In today’s digital world, businesses generate huge volumes of data through websites, online sales, customer interactions, marketing activities, and other digital channels. Data Analytics helps convert this raw information into valuable insights that businesses can use to make informed decisions.

Using Data Analytics, companies can understand customer behaviour, evaluate sales performance, identify business trends, and measure marketing effectiveness. These insights help businesses improve their products, services, customer experience, sales strategies, and marketing campaigns.

For example, imagine you run an e-commerce business. You can use Data Analytics to identify your best-selling products, understand customer purchasing behaviour, compare monthly sales, and discover which marketing activities attract more customers. These insights help you improve your products, services, marketing strategies, and overall business performance.

A professional Data Analyst is responsible for collecting, organizing, cleaning, and analyzing data to identify useful patterns and trends. They also prepare reports and create interactive dashboards to present complex information in an easy-to-understand format. To perform these tasks efficiently, Data Analysts use industry-relevant tools such as Advanced Excel, SQL, Python, and Power BI to manage datasets, perform analysis, and communicate meaningful insights.

If you want to develop these in-demand analytical skills, enrolling in a professional Data Analytics Course in Delhi can be a great starting point. At Tech Explica, students, graduates, and beginners can learn essential data analytics concepts through practical training, industry-relevant tools, and hands-on projects. The training helps learners understand real-world data analysis techniques, build practical experience, and develop the skills required to explore career opportunities in the growing field of Data Analytics.

With the right guidance and practical knowledge, a professional Data Analytics Course in Delhi can help you build a strong foundation in data analysis and prepare for future career opportunities.


INDUSTRY PLACEMENTS

Our Students Work At

Our alumni are making an impact at top companies around the world.

Student Success Stories

Our students don't just learn, they achieve. Here are a few of our placed students who are building their careers at leading companies.

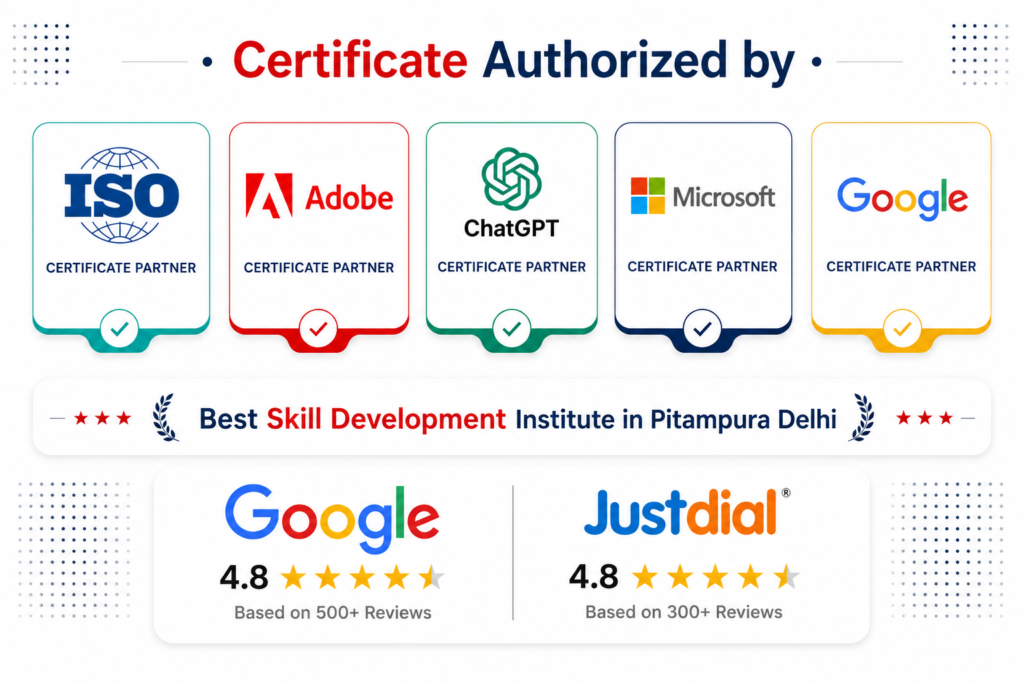
Certificate Partners for Graphic Design Course in Delhi at Tech Explica

Tools You'll Learn in Our Data Analytics Course

Learn to work with industry-relevant tools used in data analysis, visualization, programming and database management. Build practical skills and gain hands-on experience with essential data analytics technologies.

Apache Spark

Power BI

Jupyter Notebook

Python

Power Query

GitHub

Postman

Visual Studio Code

NumPy

MySQL

Gain practical exposure to tools used in modern data analytics workflows.
DATA ANALYTICS TRAINING

What Will You Learn in Our Data Analytics Course?

Take up a professional Data Analytics Course in Delhi and learn how to acquire, clean, analyze, and interpret data to make better business decisions. At Tech Explica, we provide practical Data Analytics training using industry-standard tools and techniques to help students understand how data is collected, analyzed, and used in real-world business scenarios. During the training, you will learn how to work with different types of datasets, discover useful patterns, prepare reports, and generate valuable insights. You will also gain practical knowledge of essential tools and concepts used in Data Analytics. Here are the key topics covered in our course:.

In the Data Analyst training, you will learn how to work with different types of datasets, discover useful patterns, prepare reports and generate valuable insights. You will also gain knowledge of important tools and concepts used in Data Analytics. Here are the key topics covered in the course:

Tools & Skills You'll Learn

01 / 06

Power BI

Learn to transform raw data into interactive reports and dashboards. Explore data importing, preparation, visualization and presenting meaningful business insights through clear and engaging reports.

02 / 06

Advanced Excel

Develop practical Excel skills using formulas, functions, sorting, filtering, Pivot Tables and charts. Learn to organize datasets, perform calculations and prepare informative reports.

03 / 06

Python for Data Analytics

Understand Python fundamentals and their applications in data analysis. Learn data handling and analysis techniques with essential libraries such as Pandas and NumPy.

04 / 06

SQL (Structured Query Language)

Learn to retrieve, filter, manage and analyze data from databases. Practice SQL commands such as SELECT, WHERE, GROUP BY, aggregate functions and JOINs to work efficiently with structured data.

05 / 06

Data Cleaning / Data Visualization

Learn to identify missing values, fix inconsistencies and organize raw datasets. Create charts, graphs and visual reports to present information clearly and make data easier to interpret.

06 / 06

Statistics for Data Analytics

Learn the fundamentals of statistics used in data analysis. Understand mean, median, mode, averages, data distribution and basic statistical methods to interpret patterns, identify trends and support informed business decisions.

Data Analytics Course Syllabus in Delhi

  • Fundamentals of Data Analytics
  • Types of Data Analytics
  • Role of a Data Analyst
  • Business Applications of Data
  • Excel Formulas and Functions
  • Sorting and Filtering
  • Pivot Tables
  • Charts and Data Reporting
  • Introduction to SQL
  • Database Tables and Queries
  • SELECT and WHERE Commands
  • GROUP BY and Aggregate Functions
  • SQL JOINs
  • Python Fundamentals
  • Variables and Data Types
  • Data Handling with Pandas
  • NumPy Basics
  • Working with Datasets
  • Data Collection and Organisation
  • Handling Missing Values
  • Removing Duplicate Data
  • Data Formatting
  • Preparing Data for Analysis
  • Importing and Transforming Data
  • Data Modelling and Relationships
  • Charts and Visualisations
  • Interactive Dashboards
  • Business Reports
  • Exploring Data Patterns
  • Identifying Trends
  • Analysing Business Data
  • Interpreting Results
  • Presenting Data Insights
  • Sales Data Analysis
  • Customer Behaviour Analysis
  • Business Data Analysis
  • Report and Dashboard Creation
  • Practical Case Studies

How We Help You Build Your Data Analytics Portfolio

A strong portfolio helps you showcase your practical skills and gives potential employers a clear idea of what you can do. At Tech Explica, you work on practical projects, analyse real-world style datasets, create dashboards, and organise your work to build a professional Data Analytics portfolio.

01
01
Practical Learning

Work on Practical Projects

Students work on data analysis projects using tools such as Excel, SQL, Python and Power BI.

02
02
Show Your Skills

Create Reports & Dashboards

Build analytical reports, visualisations and dashboards that demonstrate practical data-handling skills.

03
03
Project Documentation

Document Your Projects

Organise project objectives, datasets, analysis process and key insights to create presentable project work.

04
04
Career Ready

Build a Professional Portfolio

Bring selected projects together to demonstrate your Data Analytics skills to recruiters and potential employers.

Career Opportunities

Career Opportunities After a Data Analytics Course

Explore the career paths you can pursue after completing a Data Analytics course, from Data Analyst and Business Analyst to Reporting Analyst and Business Intelligence roles. Build practical skills, understand industry requirements and take your first step towards a career in data analytics.

01 / ANALYTICS

Junior Data Analyst

Analyse datasets, prepare reports and support senior analysts with data-driven tasks.

Entry Level
02 / ANALYTICS

Data Analyst

Analyse business data, identify trends and provide meaningful insights.

Core Role
03 / BUSINESS

Business Analyst

Use data and business information to understand requirements and support better decisions.

Business
04 / REPORTING

MIS Executive

Manage business data, prepare regular MIS reports and maintain reporting systems.

Reporting
05 / REPORTING

Reporting Analyst

Create performance reports, track key metrics and present business information clearly.

Reporting
06 / BI

Business Intelligence Analyst

Work with data, dashboards and visual reports to help businesses understand performance.

BI
07 / REPORTING

Data Reporting Specialist

Prepare structured reports, organise datasets and communicate important business metrics.

Specialist
08 / DATA QUALITY

Data Quality Analyst

Check datasets for accuracy, consistency and completeness before they are used for analysis.

Data Quality
09 / OPERATIONS

Operations Analyst

Analyse operational data to identify patterns, inefficiencies and opportunities for improvement.

Operations
10 / MARKETING

Marketing Analyst

Analyse campaign, customer and marketing data to understand performance and trends.

Marketing
11 / SALES

Sales Analyst

Analyse sales data, revenue trends, customer patterns and product performance.

Sales
12 / BI

BI / Dashboard Developer

Build interactive dashboards and visual reports using tools such as Power BI to present business insights.

Dashboard
Multiple Career Paths in Data Analytics
CAREER & SALARY INSIGHTS

Data Analytics Job Salary in India

A career in Data Analytics can open doors to different professional opportunities across industries. Salary depends on the job role, practical skills, experience, location and the company you work for. Here is an indicative overview of annual salary ranges for some common data analytics and related roles in India.

Explore Data Analytics Job Roles

12 Career Options
NO. JOB ROLE APPROX. ANNUAL SALARY
01Junior Data Analyst₹2.5 – 4.5 LPA
02Data Analyst₹3.5 – 7 LPA
03Business Analyst₹4 – 8 LPA
04MIS Executive₹2.4 – 4 LPA
05Reporting Analyst₹3 – 6 LPA
06Business Intelligence Analyst₹4 – 9 LPA
07Data Reporting Specialist₹3 – 6 LPA
08Data Quality Analyst₹3 – 7 LPA
09Operations Analyst₹3 – 7 LPA
10Marketing Analyst₹3 – 7 LPA
11Sales Analyst₹3 – 7 LPA
12BI / Dashboard Developer₹4 – 9 LPA

* Salary figures are indicative estimates and may vary depending on skills, experience, location, industry and employer.

Who Can Enrol in This Course?

Our Data Analytics Training in Delhi is suitable for students, graduates, freshers, working professionals, and beginners who want to understand how data is used in real-world business situations. The training helps learners develop practical skills in data analysis, data visualization, statistics, SQL, Excel, and Business Intelligence tools. Whether you are a student looking to learn beyond your academic curriculum, a fresher preparing for your first job, or a working professional interested in improving your analytical skills, this training can help you build relevant knowledge and practical experience.

Even if you have no prior experience in Data Analytics, you can start learning from the basics. Our Data Analytics Course in Delhi follows a beginner-friendly learning approach, starting with spreadsheets and working with datasets, followed by Data Analysis using SQL, preparing Excel reports, and building interactive dashboards in Power BI. You will understand how these tools work and how businesses use them to analyze information and make decisions. You don’t need an advanced programming or technical background to get started. Basic computer knowledge, logical thinking, and an interest in working with data are enough to begin your Data Analytics learning journey.

WHY CHOOSE TECH EXPLICA?

Why Choose Tech Explica for Data Analytics Training in Delhi?

Choosing the right institute can make a real difference when you are starting your journey in Data Analytics. At Tech Explica, the focus is on making learning practical, easy to understand and relevant to real-world work.

Instead of limiting lessons to theory, students get opportunities to work with datasets, practice analytical techniques, complete assignments and develop projects that help them understand how data is used in everyday business situations.

Our Data Analytics training in Delhi follows a structured learning approach where students can build their knowledge step by step with trainer guidance. From understanding Excel and SQL to creating reports and interactive dashboards, learners get exposure to the tools and techniques used in data analysis.

The classroom learning environment also allows students to interact with trainers, discuss problems and get help when they find a topic difficult.

What Makes Our Data Analytics Training Different?

Here are some reasons students can consider Tech Explica:

01

Practical, Project-Based Learning

Understand concepts through hands-on exercises, datasets, assignments and project work.

02

Trainer Guidance

Learn concepts with guidance from trainers and get help while working through practical topics.

03

Classroom Learning Environment

Interact with trainers, ask questions and learn alongside other students.

04

Industry-Relevant Tools

Develop practical knowledge of Excel, SQL, Power BI and other tools included in the course.

05

Assignments and Practice

Strengthen your understanding by applying what you learn to different data analysis tasks.

06

Career and Placement Assistance

Get guidance with resume preparation, interview practice and internship or job opportunities through the institute's career support.

Whether you are a fresher, graduate or working professional, Tech Explica aims to help you move beyond theoretical knowledge and develop practical skills that you can continue building throughout your career.

Understand the Difference

Data Analytics vs Data Science – What Is the Difference?

Both fields work with data, but they solve different problems. Explore their goals, common tasks, tools and career opportunities to understand how they differ.

Data Analytics

Understand the Past & Present

Data Analytics focuses on examining existing data to discover useful insights, understand business performance and support better decision-making.

Main Goal

Understand what happened and why through data analysis and meaningful insights.

Common Tasks

Data analysis, report preparation, identifying trends and creating dashboards.

Common Tools

Microsoft Excel, SQL and Power BI.

Career Focus

Data Analyst, MIS Executive and Reporting Analyst.

Data Science

Predict the Future & Build Solutions

Data Science combines programming, statistics and machine learning to explore complex data, make predictions and build intelligent, data-driven solutions.

Main Goal

Predict what may happen and develop data-driven solutions using advanced techniques.

Common Tasks

Predictive modelling, machine learning, statistical analysis and experimentation.

Common Tools

Python, SQL, Jupyter Notebook and machine learning libraries.

Career Focus

Data Scientist, Machine Learning Engineer and related roles.

TAKE THE NEXT STEP

Join the Best Data Analytics Course in Delhi at Tech Explica

Ready to build a career in Data Analytics? Join Tech Explica's Data Analytics Course in Delhi and develop practical skills in Advanced Excel, SQL, Python, Power BI and Data Visualization. Gain hands-on experience through practical projects, learn to analyze real-world business data and prepare yourself for emerging career opportunities in the data analytics industry.

Everything You Need to Know About Our Course

The course is suitable for students, graduates, freshers, working professionals and beginners who want to develop practical skills in data analysis. Basic computer knowledge and an interest in working with data are helpful. No previous Data Analytics experience is required to get started.

Yes, beginners can start learning Data Analytics without prior coding experience. You can begin with Excel, data handling, reporting and visualization before moving on to SQL and other concepts included in the course. Basic computer knowledge and logical thinking are useful.

You will learn practical concepts related to data analysis, data visualization, statistics, SQL, Excel and business intelligence tools such as Power BI. The training focuses on understanding how these tools are used to organize data, prepare reports and create meaningful insights.

After developing relevant skills, you can explore career opportunities such as Junior Data Analyst, Data Analyst, MIS Executive, Reporting Analyst, Business Analyst and Business Intelligence Analyst. The roles you qualify for depend on your practical skills, knowledge and experience.

A fresher entering the Data Analytics field in Delhi may find entry-level opportunities with salaries around ₹2.5–4.5 LPA, depending on the role, company, practical skills and qualifications. Salary packages can vary, and developing strong Excel, SQL and Power BI skills can help improve career opportunities.


Please enable JavaScript in your browser to complete this form.

Name

This will close in 0 seconds